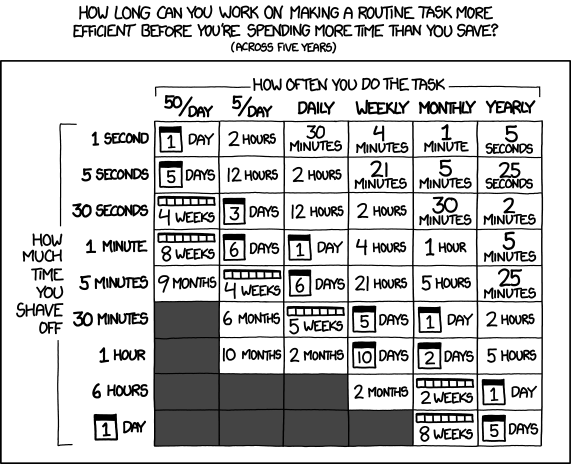
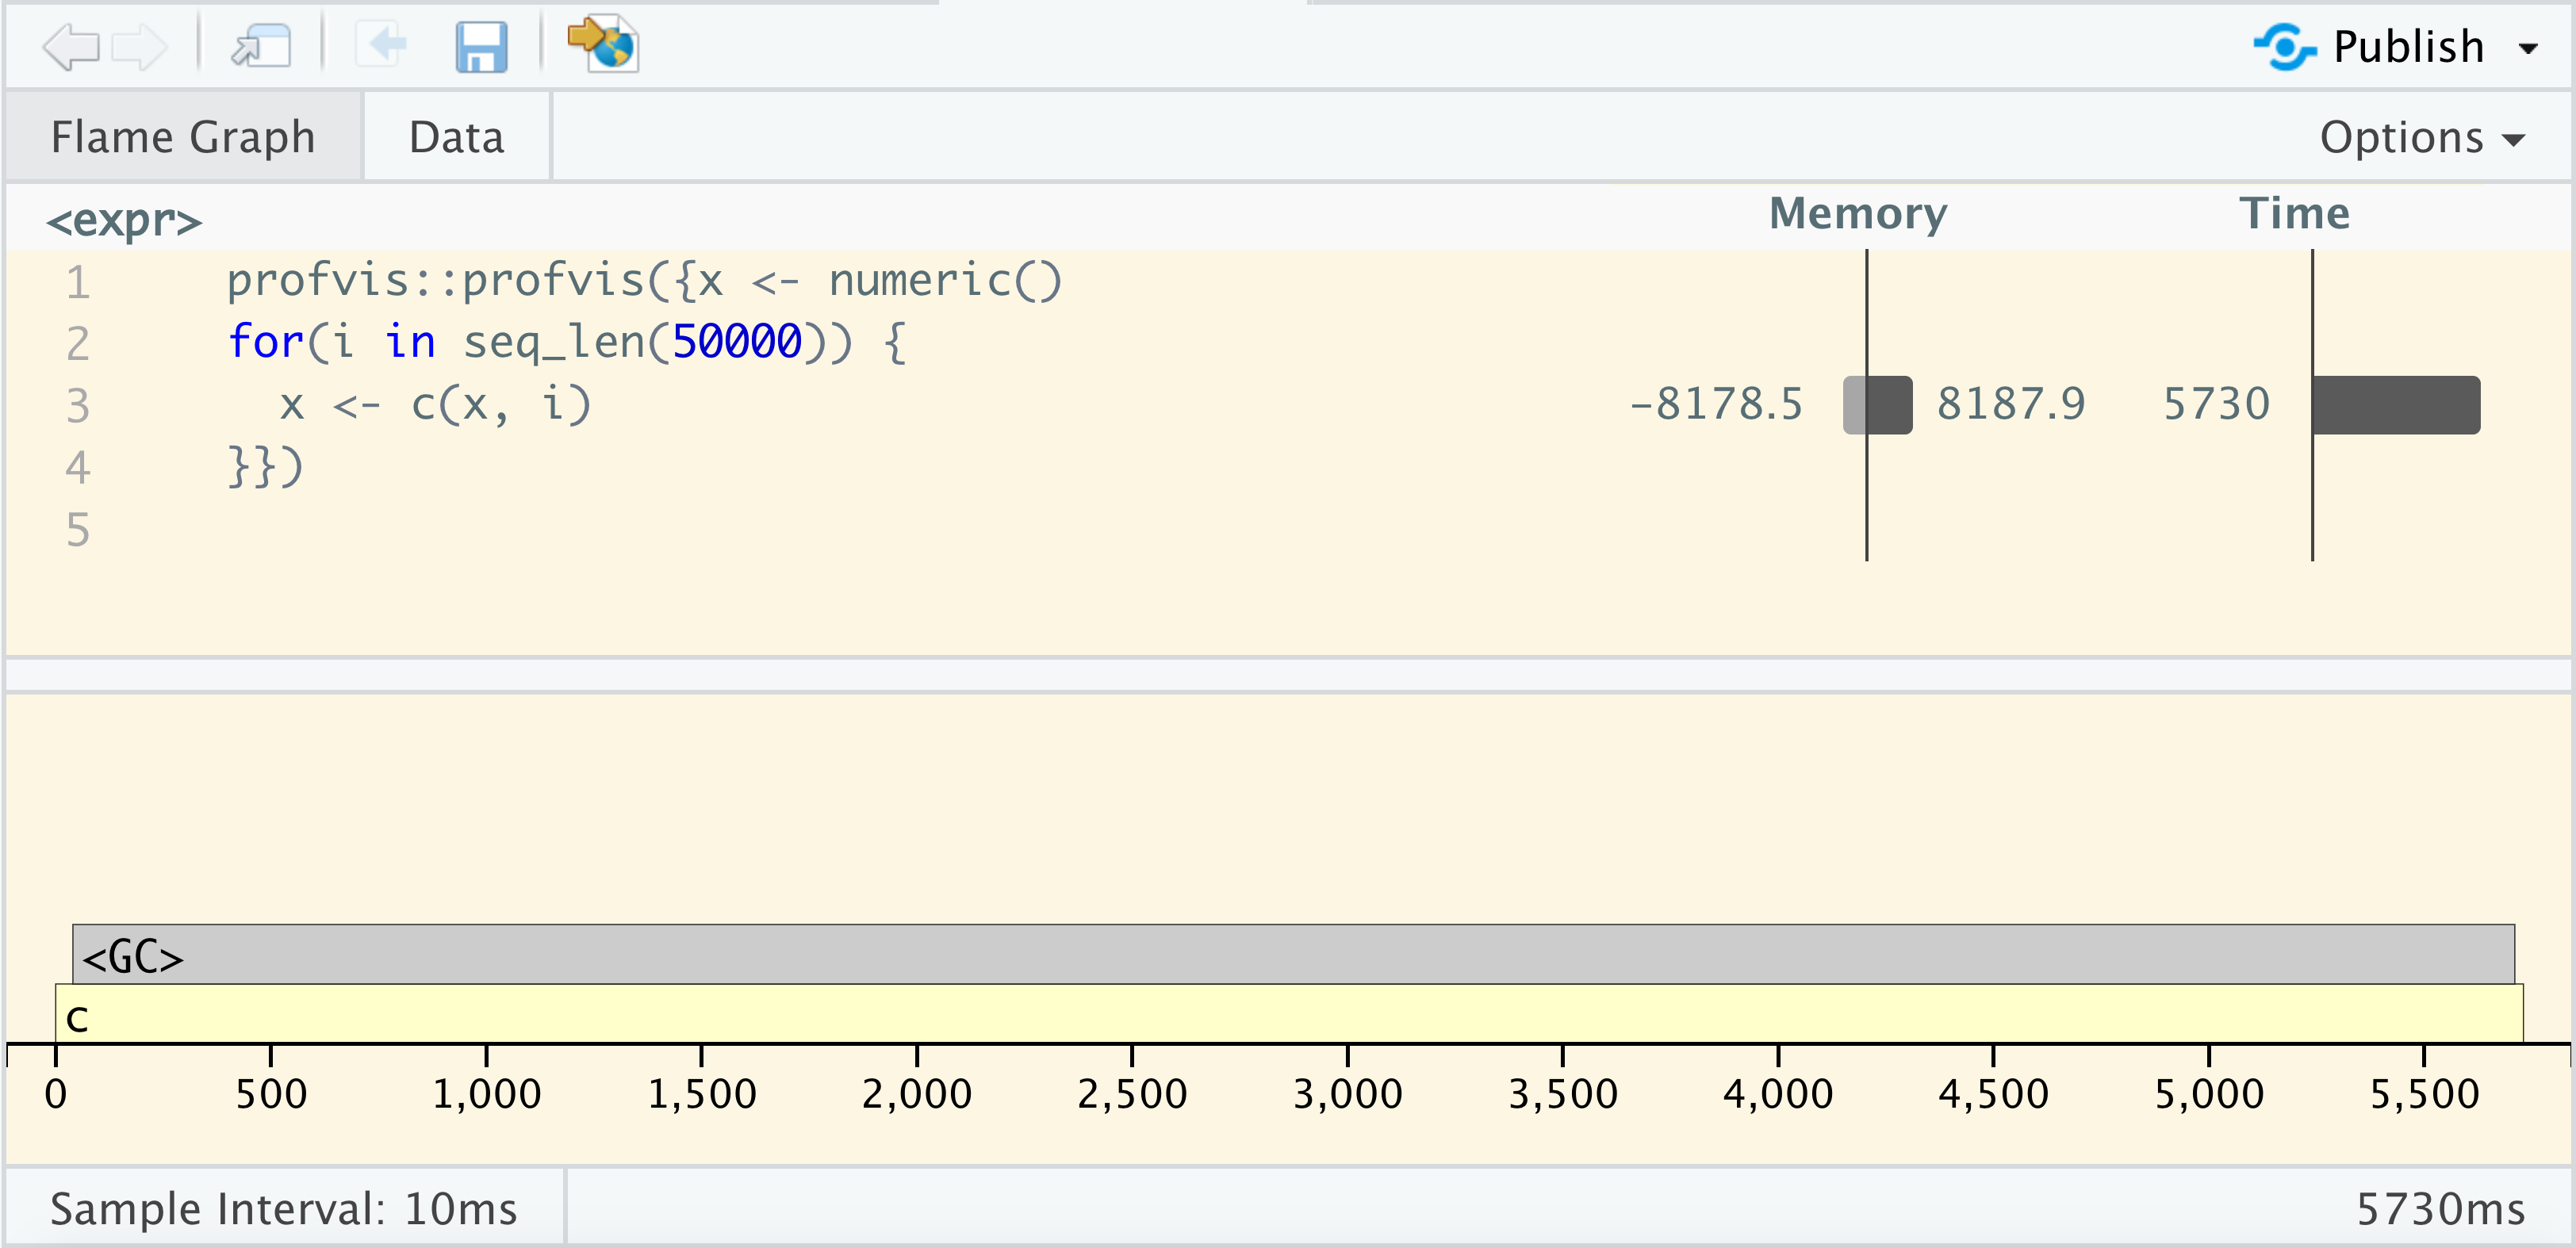
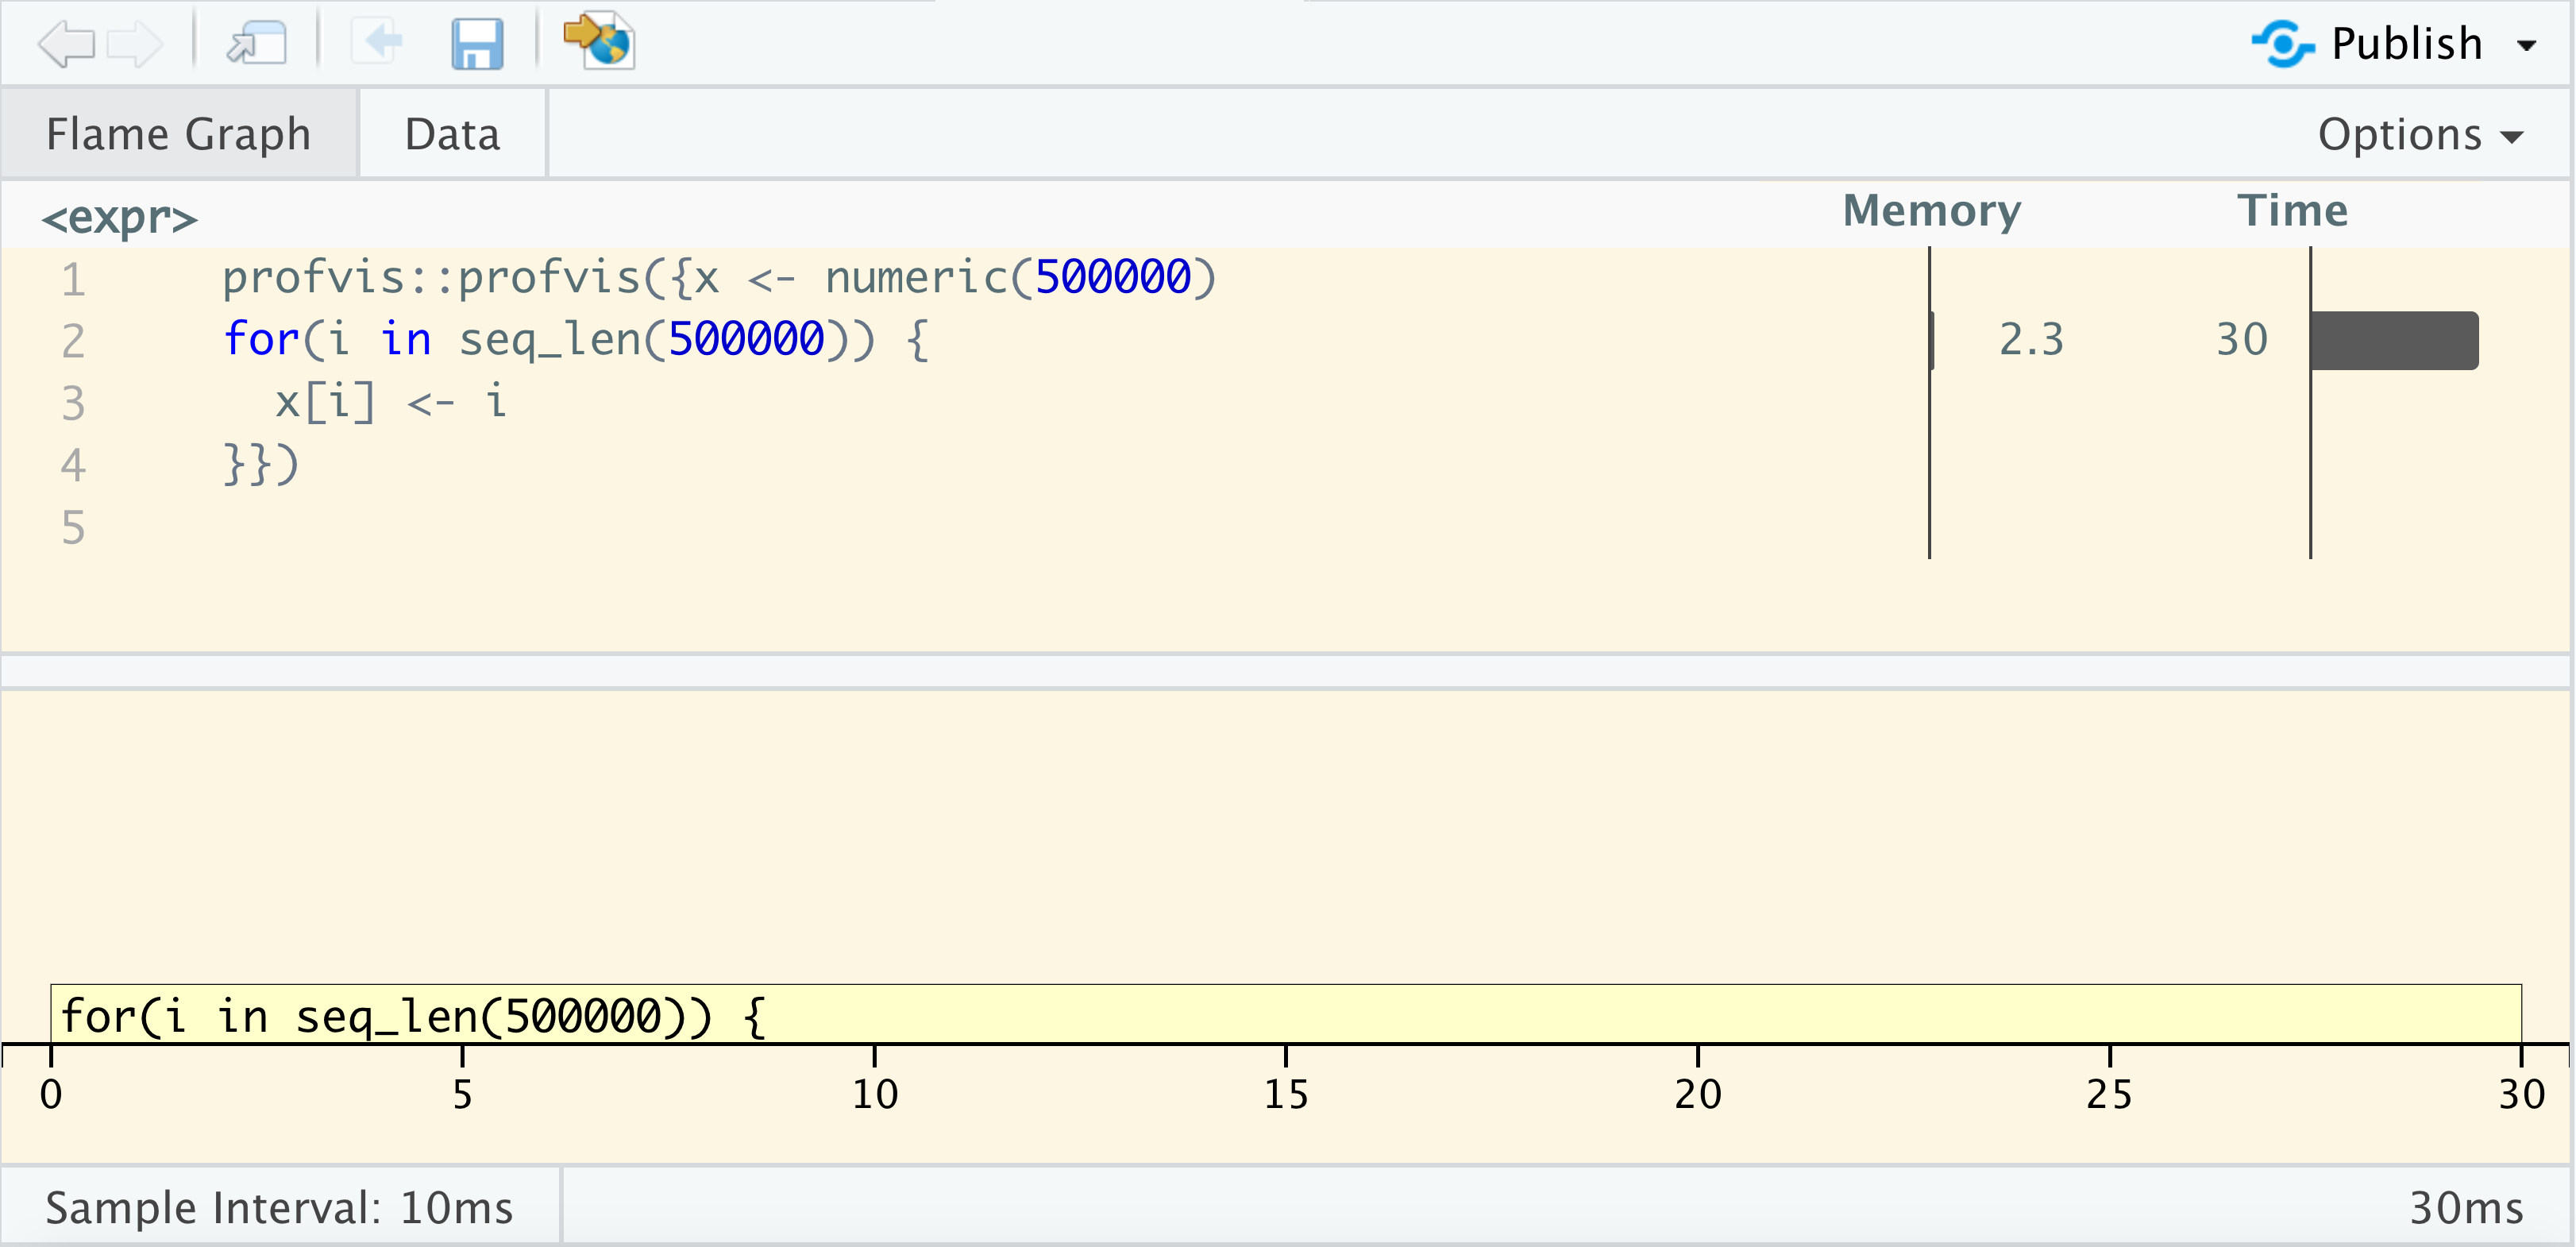
class: center, middle, title-slide # Debugging and Profiling in R ### Emil Hvitfeldt ### 2019-2-19 --- ## Fix performance ### Debugging ## Measure performance ### Profiling / Benchmarking ## Improve performance ### Code improvements --- .center[ ## The Art of identifying the right line(s) of code ] -- <br> ### Identify bottlenecks -- <br> ### Isolate problem -- <br> ### Create reproducible example --- .center[  ] ??? Time is dynamic --- # Debugging <br> > Debugging is like being the detective in a crime movie where you're also the murderer. .right[Filipe Fortes] --- # There are 2 types of errors ### Getting an error .hidden[Getting a warning] .hidden[R crashes] ### Don't get expected outcome .hidden[Test failed] .hidden[no outcome] --- # There are ~~2~~ many types of errors ### Getting an error Getting a warning R crashes ### Don't get expected outcome Test failed no outcome --- # Plan of attack ### google the error message Very real chance that someone elser had the same problem you just had. ### Isolate the problem Your problem will most likely be confined to one area of your code. ### Make it repeatable Work towards a minimal reproducible error. --- # Call/Ask a friend <img src='https://vignette.wikia.nocookie.net/millionaire/images/8/88/ClassicPAF.png/revision/latest?cb=20160407180816' align="right" height="139" /> It can be hard to google something if you don't know the name of the thing you want or have a hard time describing it concisely. ### Problem I have a list of numbers and I want to add each number to all the previous numbers in a list. ### Solution > you are thinking of a cumulative sum, implemented in R as `cumsum()`. .right[friend] ---  ---  --- # Hunting tools ## traceback() ## debug() ## breakpoints ## broswer() --- # Urn simulation ```r main_function <- function(n_max, n_black, balls, n) { check_input(n_max, n_black, balls, n) x_prep <- prep_data(n_black, balls) res <- numeric(n) for(i in seq_len(n)) { data <- simulate_data(x_prep, n_max) res[i] <- analyse_results(data) } res } ``` --- ```r check_input <- function(n_max, n_black, balls, n) { if(!is.numeric(n_max)) stop("`n_max` must be numeric.") if(!is.numeric(n_black)) stop("`n_black` must be numeric.") if(!is.numeric(balls)) stop("`balls` must be a numeric.") if(!is.numeric(n)) stop("`n` must be a numeric.") if(length(n_max) != 1) stop("`n_max` must have length 1.") if(!is.numeric(n_black)) stop("`n_black` must have length 1.") if(!is.numeric(n)) stop("`n` must have length 1.") } ``` --- ```r prep_data <- function(n_black, balls) { c(rep(0, n_black), ball_create(balls)) } ball_create <- function(balls) { ball_id <- seq_len(balls) res <- numeric() for(i in ball_id) { res <- c(res, rep(ball_id[i], balls[i])) } res } ``` ```r simulate_data <- function(urn, n_max) { for (j in length(urn):n_max) { draw <- sample(urn, 1) if(draw == 0) { urn <- c(urn, max(urn) + 1) } else { urn <- c(urn, draw) } } urn } ``` ```r analyse_results <- function(x) sum(x == 1) ``` --- ```r options(warn = 2) main_function(n_max = 50, n_black = 1, balls = c(1, 1), n = 100) traceback() ``` ``` ## 7: doWithOneRestart(return(expr), restart) ## 6: withOneRestart(expr, restarts[[1L]]) ## 5: withRestarts({ ## .Internal(.signalCondition(simpleWarning(msg, call), msg, ## call)) ## .Internal(.dfltWarn(msg, call)) ## }, muffleWarning = function() NULL) ## 4: .signalSimpleWarning("first element used of `length.out` argument", ## quote(seq_len(balls))) at #2 ## 3: ball_create(balls) at #2 ## 2: prep_data(n_black, balls) at #3 ## 1: main_function(n_max = 50, n_black = 1, balls = c(1, 1), n = 100) ``` --- # Using browser() and breakpoints <br> <br> .center[ .large[ # Live Demo ] ] .center[ urn_code.R ] ??? Using browser inside urn code Show conditional browser --- ## debug() and debugonce() ```r debug(ball_create) main_function(n_max = 50, n_black = 1, balls = c(1, 1), n = 100) debugonce(simulate_data) main_function(n_max = 50, n_black = 1, balls = c(1, 1), n = 100) ``` --- # Write tests for your code <br> ## For every fixed bug --- # Benchmarking <br> > Don't fix something that is running fast enough. .right[Unknown] --- # 2 types of benchmarking ## Slow (time > 1 sec) `system.time()` *tictoc* package ## Fast (time < 1 sec) Microbenchmarking *bench* package --- # Timing slow code ```r fibonacci <- function(n) { if(n == 0) { return(0) } if(n == 1) { return(1) } fibonacci(n - 1) + fibonacci(n - 2) } ``` -- ```r system.time( fibonacci(30) ) ``` ``` ## user system elapsed ## 0.886 0.011 0.896 ``` --- # Timing slow code ```r fibonacci <- function(n) { if(n == 0) { return(0) } if(n == 1) { return(1) } fibonacci(n - 1) + fibonacci(n - 2) } ``` ```r system.time( fibonacci(1) ) ``` ``` ## user system elapsed ## 0 0 0 ``` --- # tictoc package for timing ```r library(tictoc) tic() X <- fibonacci(5) toc() ``` ``` ## 0.004 sec elapsed ``` ```r tic("fibonacci with n = 5") X <- fibonacci(5) toc() ``` ``` ## fibonacci with n = 5: 0.001 sec elapsed ``` --- # tictoc package for timing ```r library(tictoc) tic("Total") tic("n = 4") X <- fibonacci(4) toc() tic("n = 5") X <- fibonacci(5) toc() tic("n = 6") X <- fibonacci(6) toc() toc() ``` ``` ## n = 4: 0.002 sec elapsed ## n = 5: 0.002 sec elapsed ## n = 6: 0.002 sec elapsed ## Total: 0.009 sec elapsed ``` --- # Microbenchmarking with bench package .center[ .large[ # Live Demo ] ] ??? library(magrittr) x <- runif(100) bench::mark( sqrt(x), x ^ 0.5, x ^ (1 / 2) ) %>% plot() --- # Notice the units - 1 ms, then one thousand calls takes a second. - 1 µs, then one million calls takes a second. - 1 ns, then one billion calls takes a second. --- # Profiling <br> > Never mess with someone who has more spare time than you do[.] .right[Fredrik Backman, My Grandmother Asked Me to Tell You She's Sorry] --- <br> .center[ .large[ # Live Demo ] ] .center[ urn_profile.R ] --- # Profiler information R uses a sampling/statistical profiler ### Memory left - allocated right - freed --- # `<GC>` Garbage collection Indication lots of small objects are being created ```r x <- numeric(50000) for(i in seq_len(50000)) { x <- c(x, i) } ``` ### R uses copy-on-modify ??? R has a variable-sized workspace. R maintains separate areas for fixed and variable sized objects. 350k cons cells and 6Mb of vector heap a name "has" an object `rm("x")` doesn't remove the object, it removes the name (the gc then cleans up the underlying object if it detects no 'names' point to that object later on) ---  ??? R has a variable-sized workspace. R maintains separate areas for fixed and variable sized objects. 350k cons cells and 6Mb of vector heap a name "has" an object `rm("x")` doesn't remove the object, it removes the name (the gc then cleans up the underlying object if it detects no 'names' point to that object later on) ---  ??? R has a variable-sized workspace. R maintains separate areas for fixed and variable sized objects. 350k cons cells and 6Mb of vector heap a name "has" an object `rm("x")` doesn't remove the object, it removes the name (the gc then cleans up the underlying object if it detects no 'names' point to that object later on) --- # flexibility and functionality > speed ```r var ``` ``` ## function (x, y = NULL, na.rm = FALSE, use) ## { ## if (missing(use)) ## use <- if (na.rm) ## "na.or.complete" ## else "everything" ## na.method <- pmatch(use, c("all.obs", "complete.obs", "pairwise.complete.obs", ## "everything", "na.or.complete")) ## if (is.na(na.method)) ## stop("invalid 'use' argument") ## if (is.data.frame(x)) ## x <- as.matrix(x) ## else stopifnot(is.atomic(x)) ## if (is.data.frame(y)) ## y <- as.matrix(y) ## else stopifnot(is.atomic(y)) ## .Call(C_cov, x, y, na.method, FALSE) ## } ## <bytecode: 0x7fac0a7ee628> ## <environment: namespace:stats> ``` --- <img src="index_files/figure-html/unnamed-chunk-19-1.png" width="700px" height="99%" style="display: block; margin: auto;" /> --- # Code improvements <br> > “ The first 90% of the code accounts for the first 90% of the development time. The remaining 10% of the code accounts for the other 90% of the development time. ” .right[ Tom Cargill] --- # 4 ways to speed up code ## Buy a bigger computer ## Optimize R code ## Parallelize ## Rewrite code in c++ --- # 4 ways to speed up code ## .light[Buy a bigger computer] ## Optimize R code ## .light[Parallelize] ## .light[Rewrite code in c++] --- # Pattern recogniction & trial and error <br> ## Gain speed by doing less <br> More examples at https://github.com/USCbiostats/software-dev/tree/master/Slow_patterns --- # unlist() ```r list_obj <- list(a = 1, b = 2, c = 3) bench::mark(check = FALSE, unlist(list_obj), unlist(list_obj, use.names = FALSE) )[c("expression", "min", "median", "itr/sec")] ``` ``` ## # A tibble: 2 x 4 ## expression min median `itr/sec` ## <bch:expr> <bch:tm> <bch:tm> <dbl> ## 1 unlist(list_obj) 1.24µs 1.53µs 499753. ## 2 unlist(list_obj, use.names = FALSE) 893ns 1.03µs 862971. ``` --- # table vs tabulate ```r x <- sample(x = 1:6, size = 100, replace = TRUE) ``` ```r table(x) ``` ``` ## x ## 1 2 3 4 5 6 ## 17 18 20 14 14 17 ``` ```r tabulate(x) ``` ``` ## [1] 17 18 20 14 14 17 ``` --- ```r bench::mark(check = FALSE, table(x), tabulate(x) ) %>% plot() ``` ``` ## Loading required namespace: tidyr ``` <img src="index_files/figure-html/unnamed-chunk-23-1.png" width="700px" style="display: block; margin: auto;" /> --- # Use matrix algebra Calculate the magnitude of each point `sqrt(x^2 + y^2)` ```r x <- matrix(rnorm(20), ncol = 2) colnames(x) <- c("x", "y") ``` ```r x ``` ``` ## x y ## [1,] 0.03176311 -0.78602443 ## [2,] 0.99540252 -0.30501144 ## [3,] 0.97726328 0.09244702 ## [4,] -1.30320595 0.15071442 ## [5,] 0.36710347 1.52428114 ## [6,] 0.06103713 -1.94108299 ## [7,] 1.15214391 -1.38993783 ## [8,] 0.04327795 1.94889399 ## [9,] -0.48766971 0.68471476 ## [10,] -0.91126743 -1.45609084 ``` --- # Use matrix algebra .pull-left[ ```r x[, 1, drop = FALSE] + x[, 2, drop = FALSE] ``` ``` ## x ## [1,] -0.7542613 ## [2,] 0.6903911 ## [3,] 1.0697103 ## [4,] -1.1524915 ## [5,] 1.8913846 ## [6,] -1.8800459 ## [7,] -0.2377939 ## [8,] 1.9921719 ## [9,] 0.1970451 ## [10,] -2.3673583 ``` ] .pull-right[ ```r y <- matrix(c(1, 1), ncol = 1) x %*% y ``` ``` ## [,1] ## [1,] -0.7542613 ## [2,] 0.6903911 ## [3,] 1.0697103 ## [4,] -1.1524915 ## [5,] 1.8913846 ## [6,] -1.8800459 ## [7,] -0.2377939 ## [8,] 1.9921719 ## [9,] 0.1970451 ## [10,] -2.3673583 ``` ] --- # Use matrix algebra ```r x <- matrix(rnorm(20), ncol = 2) bench::mark( subset = x[, 1, drop = FALSE] + x[, 2, drop = FALSE], matrix = { y <- matrix(c(1, 1), ncol = 1) x %*% y } )[c("expression", "min", "median", "itr/sec")] ``` ``` ## # A tibble: 2 x 4 ## expression min median `itr/sec` ## <bch:expr> <bch:tm> <bch:tm> <dbl> ## 1 subset 1.35µs 1.73µs 536767. ## 2 matrix 2.56µs 3.38µs 235780. ``` --- # Use matrix algebra ```r bench::press( size = c(20, 200, 2000, 20000), { x <- matrix(rnorm(size), ncol = 2) bench::mark( matrix = { y <- matrix(c(1, 1), ncol = 1) x %*% y }, subset = x[, 1, drop = FALSE] + x[, 2, drop = FALSE] ) } ) %>% plot() ``` --- # Use matrix algebra <img src="index_files/figure-html/unnamed-chunk-30-1.png" width="700px" style="display: block; margin: auto;" /> --- .large[ .center[ # Size Matters ] ] -- <br> .center[ ## Sometimes ] -- <br> .center[ ## Always benchmark changes ] -- <br> .center[ ## Save all attempts ] --